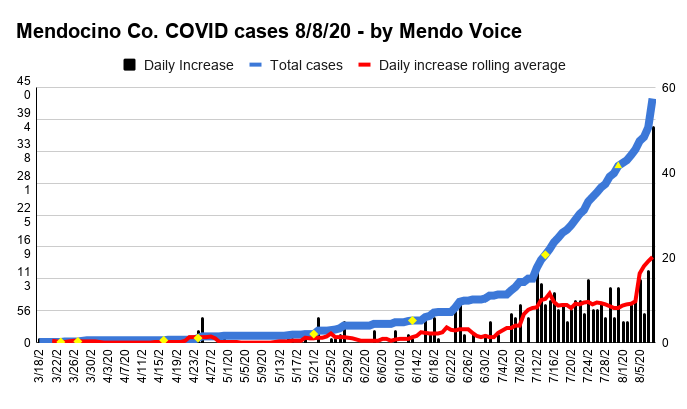
WILLITS, 8/8/20 — Mendocino County saw a major jump in the number of confirmed COVID cases today, which are partially attributed to a “process change,” at the UCSF lab. Of the 51 new cases announced today, 34 are attributable to the lab delay, according to Mendocino Public Health — those cases should be added to the case count from the past eight days.
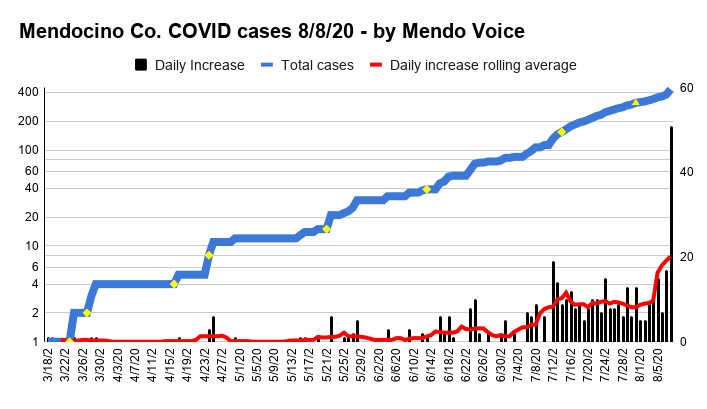
However, even with those extraneous cases subtracted, there were still 17 new cases today on top of 17 new cases yesterday, marking an acceleration in new cases. The record day for new cases in Mendocino was July 12, with 19. However, that was a Sunday with zero cases the previous day, indicating that the high count on that day was likely an artifact of many test results coming back at once. If we add in the 34 cases going back to July 31, we get an average number of new cases per day of 14.7 for the past nine days, definitely the highest average number of new cases since the pandemic began — demonstrating that infection rates are increasing, and the pandemic is far from controlled.
In her weekly press conference on Friday Mendocino County Public Health Officer Dr. Noemi Doohan said that we are no in fact “flattening the curve.” “We’re living in a pandemic, this is very very difficult, this are extremely unusual circumstances we’re living in, and it’s tragic,” said that doctor. She noted that “there’s going to be a day when the pandemic is behind us,” but explained that would be unlikely until a vaccine or effective treatment is invented. Until then this pandemic will be another one of the “new normals” that we will have to deal with.
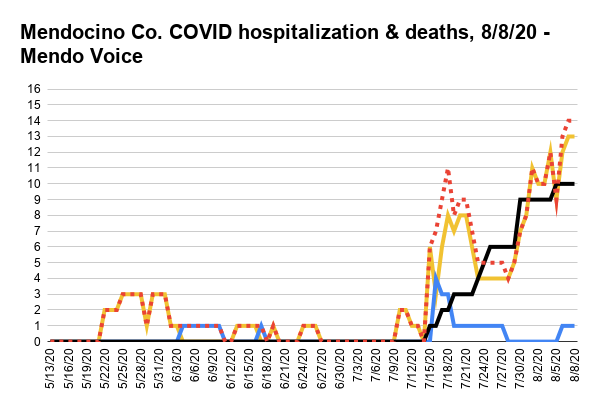
As can be seen in the graph above the the hospitalization rate has also been steadily climbing, hitting an all time high today.
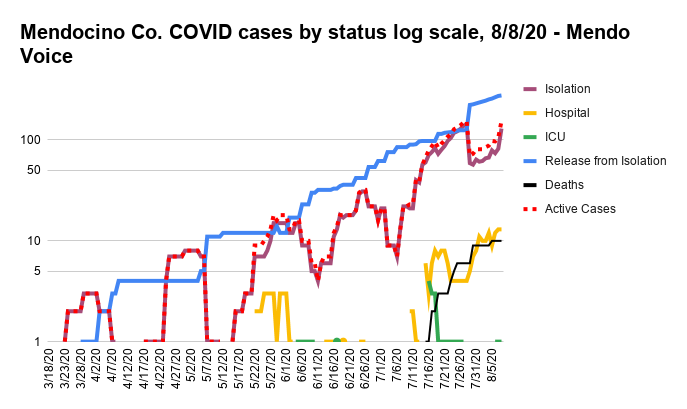
And the number of people in isolation also continues to spike back up, standing today at 130 and approaching the high of 144 that was seen on July 28. On that day the total number of what we call “active cases,” hit a high of 154. We count active cases as all people currently experiencing one of the effects contracting the virus, that is isolation, hospitalization or death. Today that active case count equally the old high of 154, even though fewer people are in isolation, due to the much larger number of people hospitalized or killed by the virus.
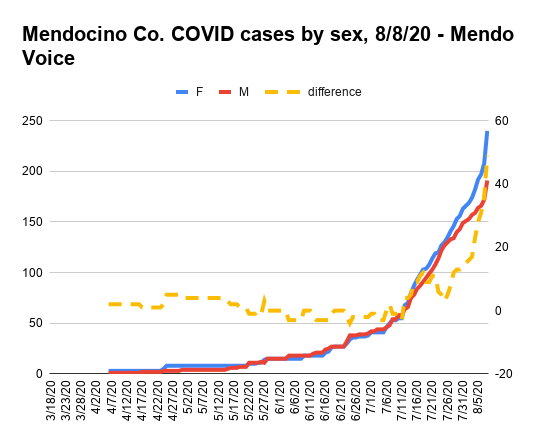
Another notable trend in Mendocino County has been the disproportionate number of women and girls (as can be seen in the graph above), as compared to men and boys who have tested positive. Whether this is due to women getting tested at higher rates, or some other factor is unclear, but the disparity has been steadily growing for some time. At the beginning of the pandemic the number count remained steady at about 50/50 with men sometimes outnumbering women and women sometimes outnumbering men. But since July 12 the number of females confirmed to have COVID has been greater than the number of males and the discrepancy has been steadily growing, with 55.7% of cases now in females and only 44.3% in males.
Here is the message from Mendocino Public Health:
COVID-19 Daily Update – 8/8/2020
51 additional cases of COVID-19 have been identified in Mendocino County, bringing the total to 431.34 of today’s 51 additional cases are the result of a UCSF lab transition and process change, as Mendocino County received 34 COVID-19 positive test results dating from July 31 to August 8th today from UCSF. Ultimately, this lab transition will enhance our ability to eliminate duplicative test results. We are continuing our efforts to ensure timely response and we are working closely with UCSF on this developing situation.
In addition, it has also come to our attention that 1 COVID-19 case this week was categorized as Ukiah Valley, rather than South Coast. This has been corrected in today’s stat tracker.
Mendocino Public Health
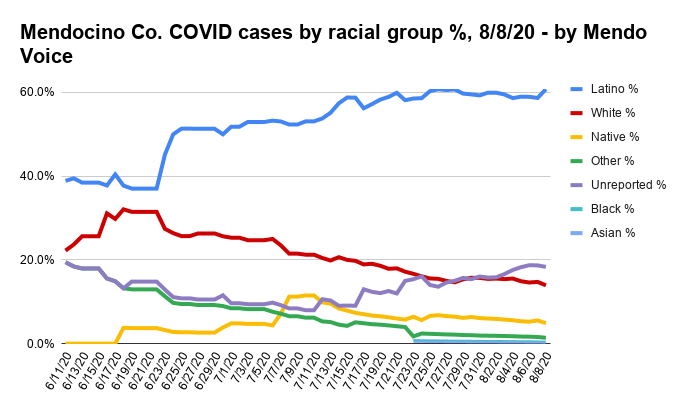
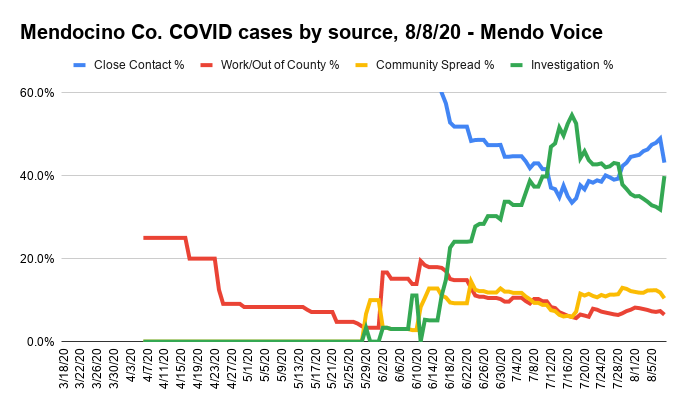
The sudden shift in the number of cases under investigation recently is likely a result of this sudden data dump form UCSF.
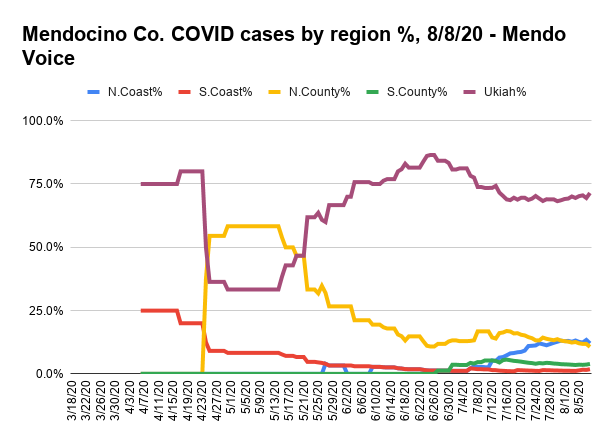
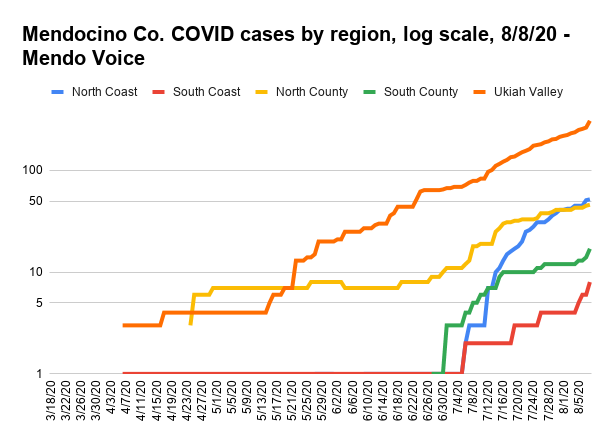
A notable trend here is that the “North Coast,” which includes Fort Bragg, has now surpassed “North County,” which includes Willits, Laytonville, and Covelo, in number of COVID cases. Fort Bragg is a larger city than Willits, and all things being equal it would be expected that there would be more cases there. In the early stages of the pandemic, however, the outbreak (or localized epidemic) was concentrated in Ukiah and Willits. It would appear that Fort Bragg now has a self-sustaining outbreak.
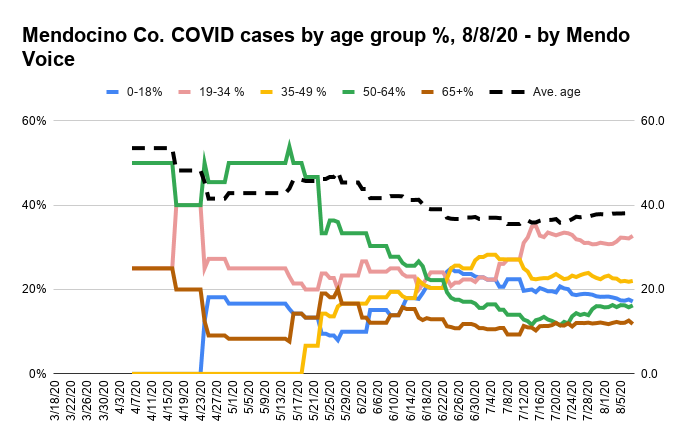
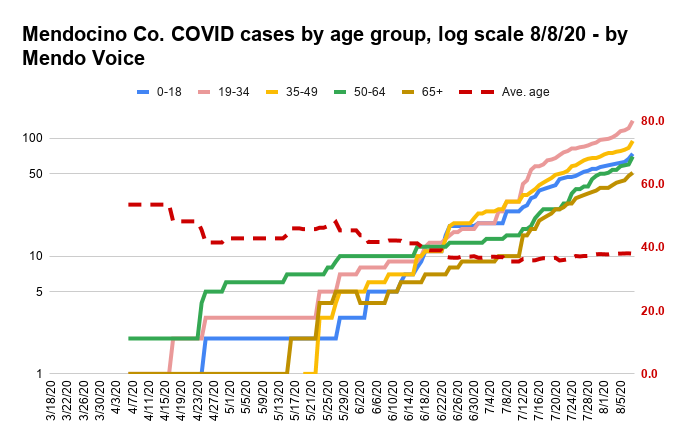
Cases continue to be highest among people of prime working years, especially in younger people who tend to be most represented in public, retail, and other kinds of jobs that would result in infection.
