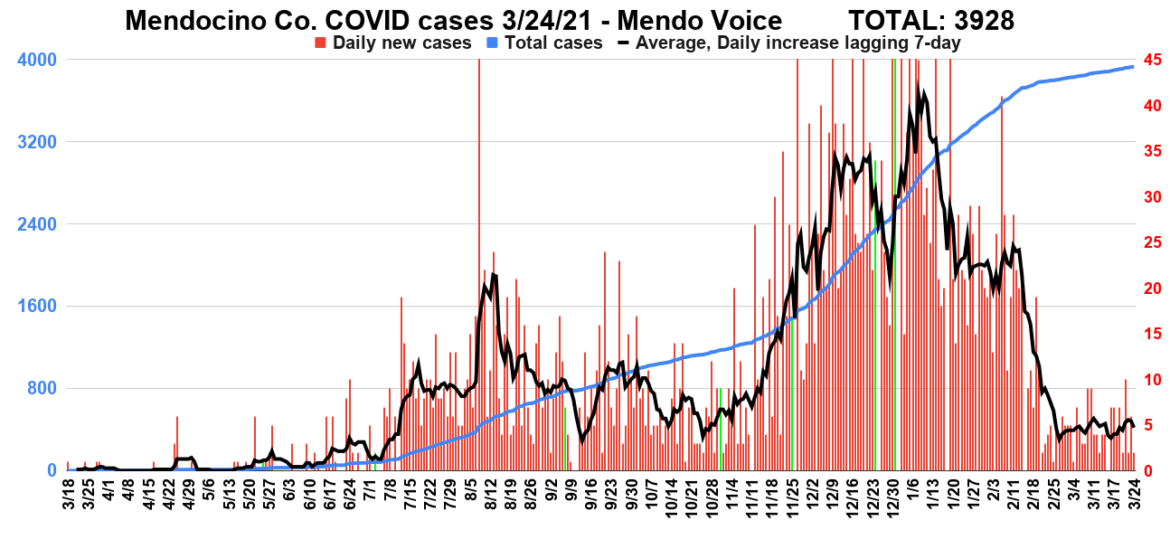
This graph shows total case count on the left axis. On the right axis are the daily new cases, as well as a 7 day, lagging, rolling average of daily increases. The green bars are holidays, beginning on the left with Memorial day, then Independence Day, Labor Day, Halloween, the day before Thanksgiving (no numbers were available on Thanksgiving), Christmas Eve, and New Year's Eve. A fairly obvious pattern of surges following holidays is evident. Since the end of the holiday season, and the change in the weather, cases have crashed.
WILLITS, 3/25/21 — The one year anniversary of both the statewide California lockdown, and the first COVID case in a Mendocino County resident passed last week with little fanfare. (Read our coverage from that day here)
On March 18, 2020 the County of Mendocino began releasing data on the COVID cases and locations. Of course, at first there was only one data point, a person living on the South Coast who’d contract the virus. But soon enough the county had to formalize its announcements, and began publishing a “dashboard” with each day’s new cases and various statistics. Mendocino’s dashboard turned out to be one of the better efforts on the part of a poorer, small county to inform the public of the relevant demographic information — outshining the efforts of even larger, wealthier counties. Since then The Mendocino Voice has been inputting this data, and collating it into various graphs that show the progress of infection and death through our population over the last year.
So here are our latest graphs, 53 weeks of COVID data:
Advertisements
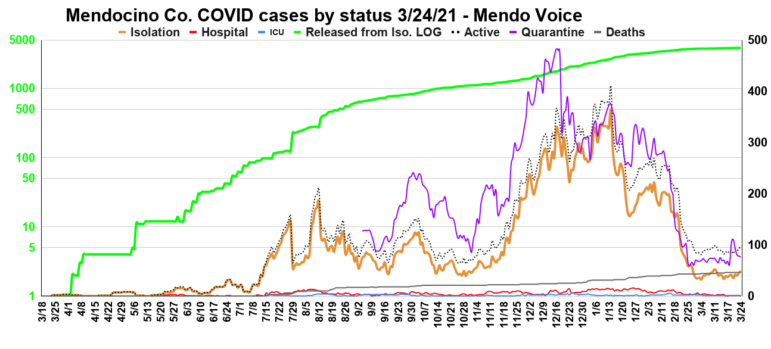
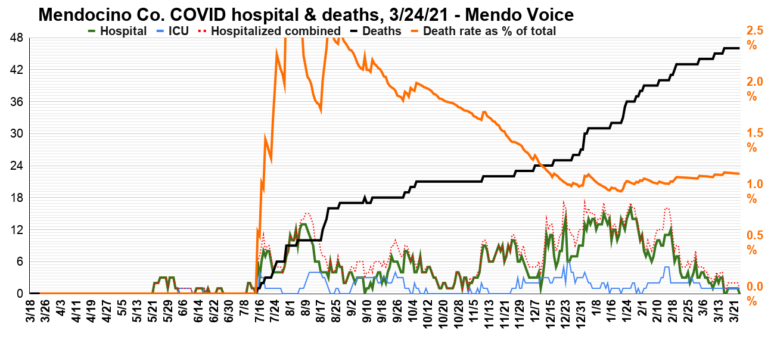
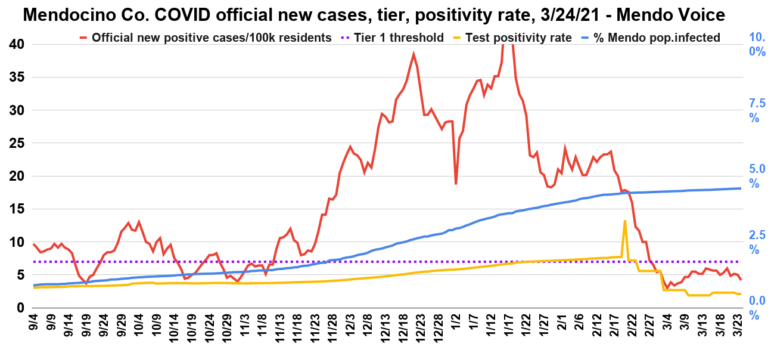
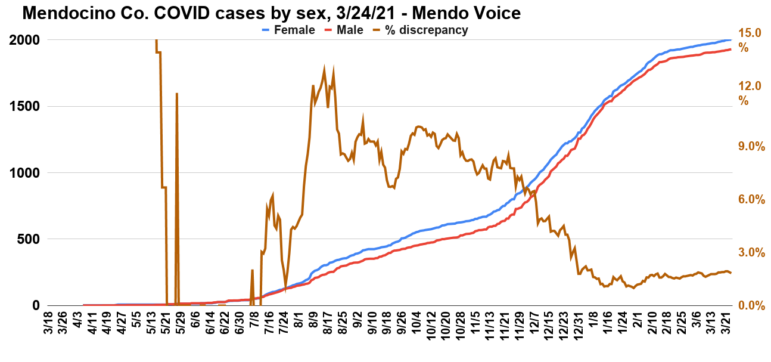
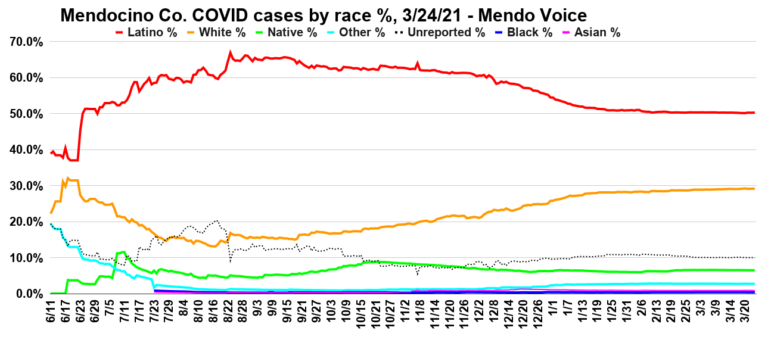
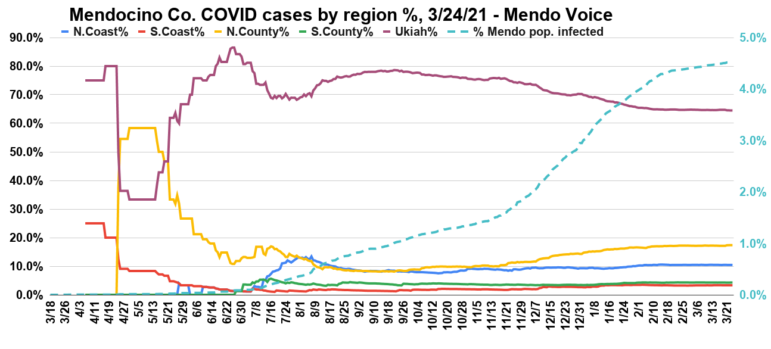
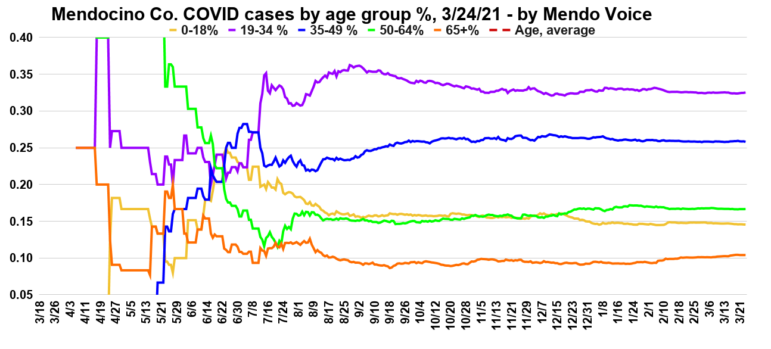
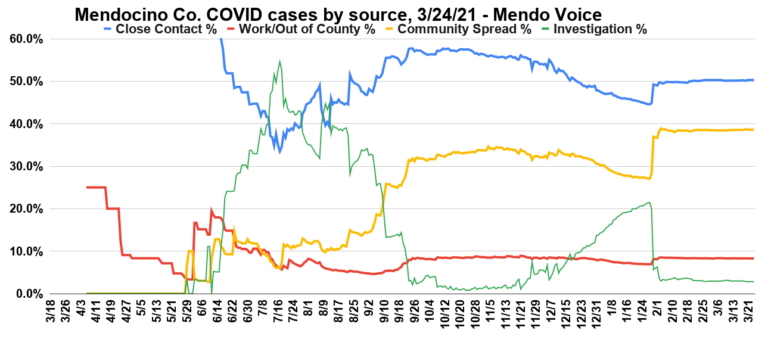
This graph shows total case count on the left axis. On the right axis are the daily new cases, as well as a 7 day, lagging, rolling average of daily increases. The green bars are holidays, beginning on the left with Memorial day, then Independence Day, Labor Day, Halloween, the day before Thanksgiving (no numbers were available on Thanksgiving), Christmas Eve, and New Year’s Eve. A fairly obvious pattern of surges following holidays is evident. Since the end of the holiday season, and the change in the weather, cases have crashed.This graph shows the count of people hospitalized, in the ICU, in isolation, killed, and released. In addition there is a line called “Active Cases” which combines all statuses except releases. This last category is to provide a nice contrast between releases, and cases of current concern and deaths. It also includes a count of people in quarantine (that is, people who may have been exposed to COVID but have not tested positive or negative). Presented along the left axis in green, in log format, is people released from isolation because as more people are infected the number of people released will steadily go up and dwarf the other statuses, making the graph otherwise unreadable.This graph shows people in regular hospital beds in green, people in the ICU in blue, and deaths in black. The dotted red line is the sum of normal hospitalizations and ICU patients giving total people in hospital. The orange line is the percentage of total recorded cases to date who have died. This number is a bit misleading because of the lag-time between contracting the virus and dying. However, even adjusting for the delay the death-rate remains quite low in Mendocino Co. as compared to other parts of the nation and world.This is the official information from the state about percentage of tests conducted daily that come back positive, and the number of new cases per day. The state uses the average number of new cases per day normed to per 100,000 people rate, on a seven day lagging average, and the positive cases as the determiners of which “tier” the county sits in.This graphs shows the growth of total cases broken down by sex. In orange is the disparity between males and females, plotted against the right vertical axis, as a percentage. This difference is important to observe as the number of women infected has steadily been higher. However, since the winter surge men have contracted the virus at a higher rate, bringing the gap down. Since the end of the surge the rates of male and female infection of become equal.Here are cases split by percentage of the total cases, broken down by race. Though Latinos make up only about a quarter of Mendocino County’s population, they are overwhelmingly the largest number of cases. Since the winter surge, though, whites have actually contracted the virus at a higher relative rate.This graph shows the percentage of cases in each region of the county. Earlier in the pandemic, due to the low numbers, small changes in numbers resulted in big fluctuations in the percentages, but as the case count grows the numbers have stabilized. The Ukiah area has about a third of the population of the county but a far greater number of cases.Cases by percentage of the total by age group.A breakdown by the percentage of the total cases acquired from the respective source. Close contact remains in the lead, and is mostly explained by close family members spreading within a household. The decrease in close contact since mid Nov. is mostly a result of the surge making it difficult to keep up with contact tracing. A major effort in contact testing in late Jan. led to clearer numbers, which showed a significant increase in community spread.